June New Home Sales Top Expectations
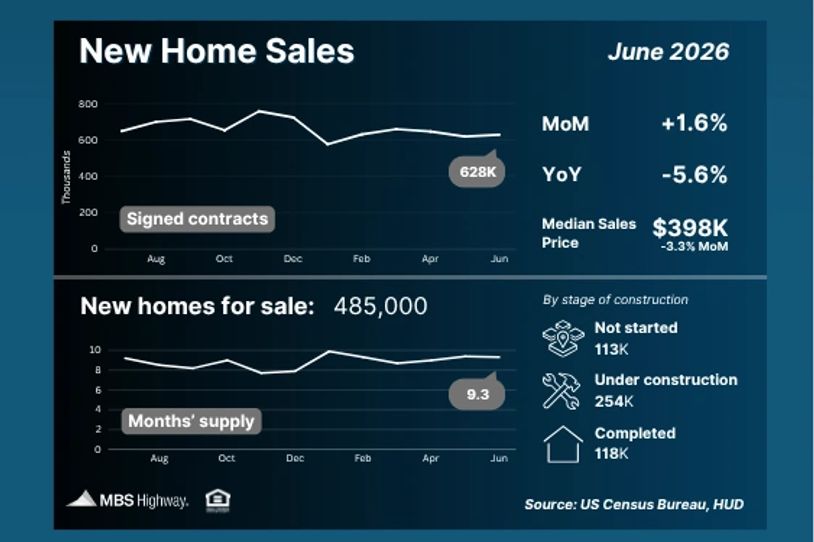
After two consecutive monthly declines, new home sales rebounded in June, rising 1.6% to a seasonally adjusted annual rate of 628,000 homes. The total came in above expectations, and May's sales were also revised higher. Compared to a year ago, however, sales were down 5.6%.
Sales increased in the Northeast, Midwest, and South, while the West experienced a 22% monthly decline. Because this report tracks signed purchase contracts, it reflects buyers who were shopping during June.
Bottom line: Some headlines highlighted a 3.3% month-over-month decline in the median new home price, leading to speculation that home prices are falling. However, the median price can change based on the mix of homes sold. In June, there was a notable increase in sales of homes priced below $300,000, which pulled the median lower.
A lower median sales price does not mean home values are declining. Broader market data and forecasts continue to point to steady home price appreciation.
Home Equity Remains a Key Wealth Building Tool
Turning to price trends, U.S. home prices increased 0.26% from June to July, according to ICE’s latest Home Price Index report, bringing year-over-year appreciation to 1.7%.
Bottom line: Since the beginning of the year, home prices have been rising at an annualized pace of about 3%, helping homeowners build equity over time. While appreciation varies by market, even modest gains can add up. For example, a $500,000 home that appreciates 3% would increase in value by approximately $15,000 over one year.
Geopolitical Risks Keep Oil Markets on Edge
On July 18, U.S. Energy Secretary Chris Wright noted that approximately 14 million barrels of crude oil per day were still moving through the Middle East – about half through the Strait of Hormuz and the other half via alternative shipping routes, including Saudi Arabia's east-west pipeline to the Red Sea. At the time, those alternative routes helped maintain global oil flows despite escalating tensions between the U.S. and Iran.
However, reports that the Iran-backed Houthi group proposed a maritime blockade targeting Saudi Arabia raised concerns about the security of those alternative shipping routes. The prospect of additional disruptions increased uncertainty in the oil market, contributing to higher oil prices and renewed volatility.
Bottom line: As geopolitical events continue to unfold, oil markets are likely to remain sensitive to developments that could affect global supply and transportation routes.
Low Jobless Claims May Not Tell the Full Story
After remaining relatively stable around 209,000 to 217,000 over the last month, new weekly unemployment claims fell to 187,000, which is the lowest level since 1969. Meanwhile, continuing unemployment claims remained elevated and relatively steady at 1.8 million.
Bottom line: The latest drop in new claims may not fully reflect underlying labor market conditions. In late June, Labor Secretary Keith Sonderling directed governors to strengthen identity and eligibility verification before distributing unemployment benefits in response to fraud that occurred during COVID. The resulting delays or cancellations in some filings may be contributing to the unusually low claims numbers.
Beyond the impact of these changes, the low level of new claims may also reflect shifts in how workers earn income, with more people turning to freelance, contract, or gig work instead of traditional unemployment benefits. This means some labor market weakness may not be fully captured in the claims data.
At the same time, the elevated level of continuing claims suggests that many unemployed workers are taking longer to find their next job, pointing to a labor market that remains challenging for those actively searching for work.
What to Watch Ahead
After a relatively quiet week, the economic calendar heats up with several key events. On Tuesday, we'll get home price data from Case-Shiller and the FHFA, while the Federal Reserve kicks off its two-day policy meeting. The main event comes Wednesday afternoon, when the Fed announces its latest interest rate decision.
Thursday brings another round of potentially market-moving data, including the latest Personal Consumption Expenditures (PCE) inflation report, the first estimate of second quarter GDP, and weekly jobless claims.
Sunset of the week: Murray, Utah